Quantcast
Channel: Streak Blog
Viewing all 125 articles
Browse latest View live

New System Columns = Less Data Entry

$
0
0

New System Columns are my favorite type of (incremental) update to offer! 


Why? Because Streak automagically (this is a real word) fills out all of the data inside System Columns for you. No clicking, no data entry, Less Effort! System columns give you an easy way to leverage all of the computing power running your pipelines.

Welcome the newest members of the System Column family:
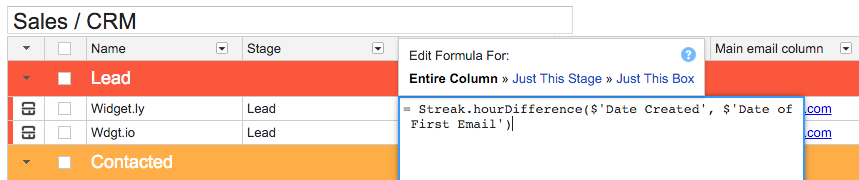
  • Days in stage: "Days in stage" displays the number of days a box has been in the current stage. Use cases (Sales, Support) that depend on not letting boxes go stale can now create a Saved View that, for example, shows all boxes that have spent 3 days or more in the current stage. Full example is below!
  • Created By: "Created by" displays the user who created the box. "Created by" is useful alongside "Assigned to" because it helps with scenarios like: I've added 5 issues to the support pipeline this week. They are all assigned to Lucas (thanks, Lucas!) so creating a Saved View that filters on "assigned to" doesn't help me very much. Instead, use "Created by" as your filter.
If you're discovering System Columns for the first time, you can also hear my mellifluous voice describe the function of each available column in this ~5 minute video: System Columns Deep Dive

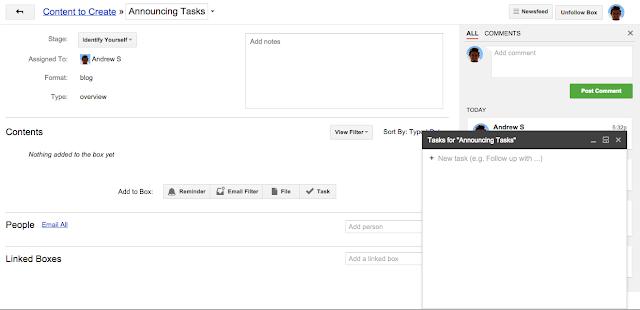
This example will show you how to use "Days in Stage" to understand who is in need of a followup.

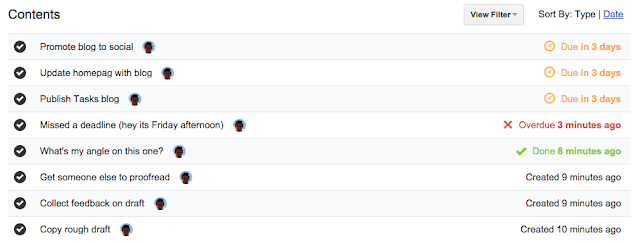
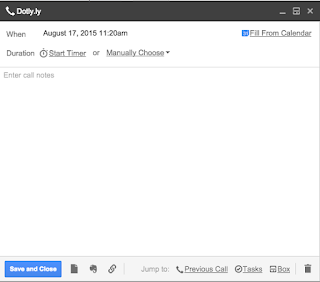
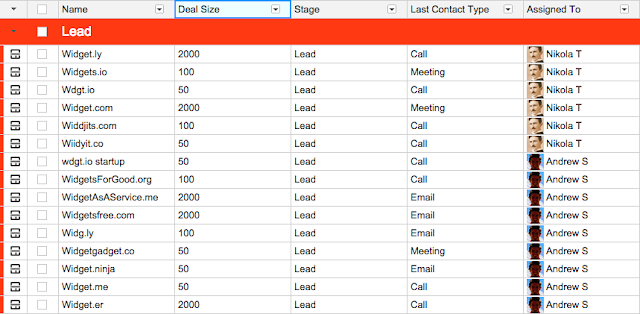
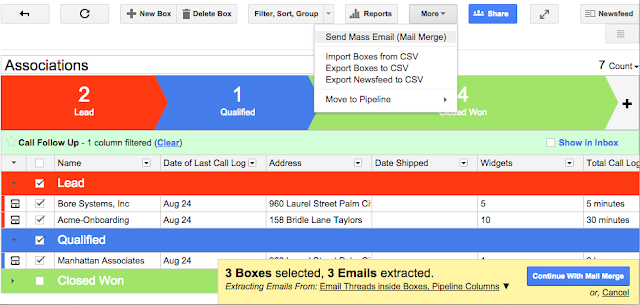
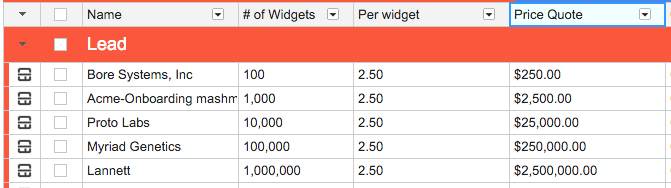
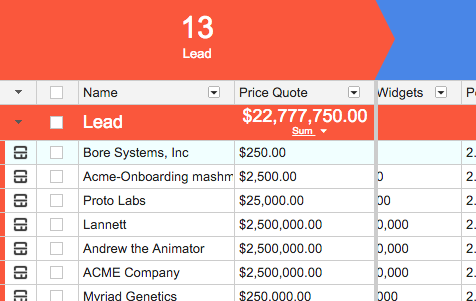
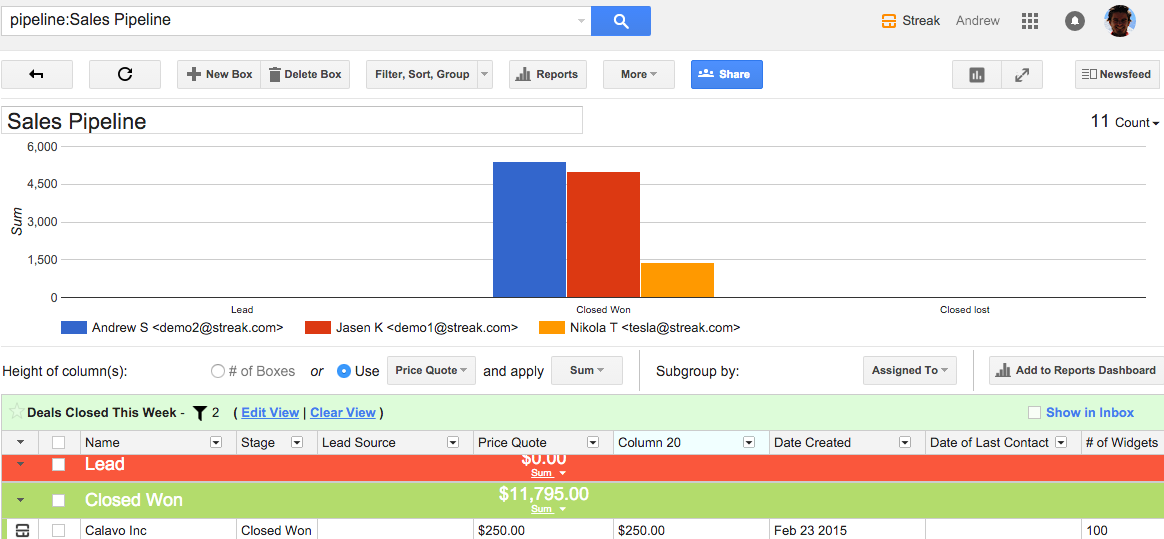
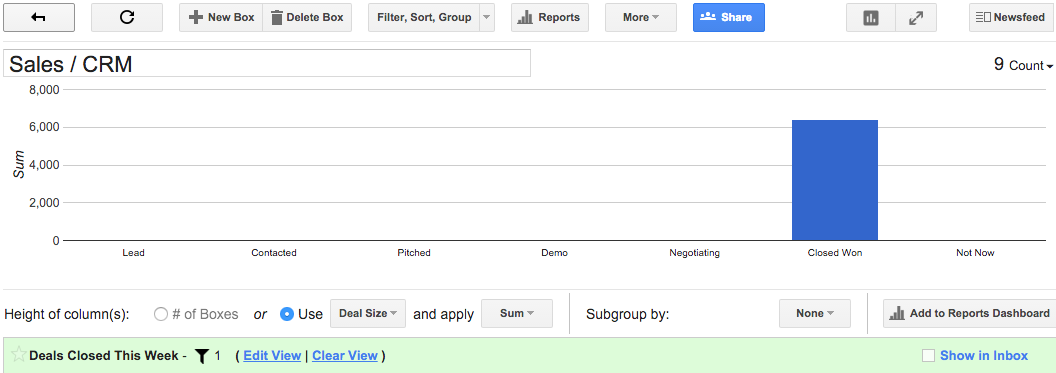
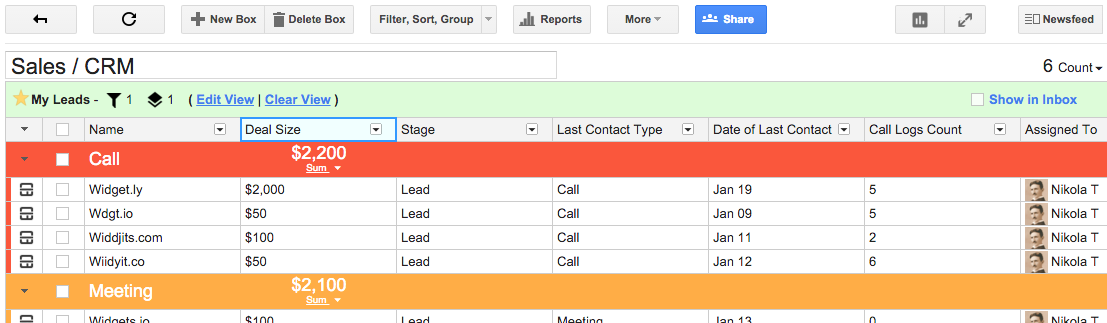
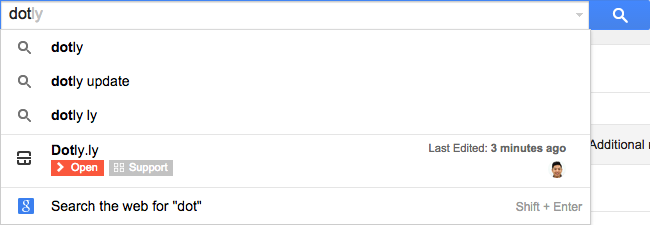
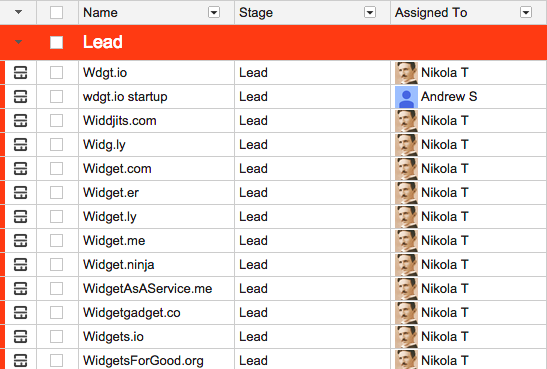
1. We'll start with the 'before' beauty shot:

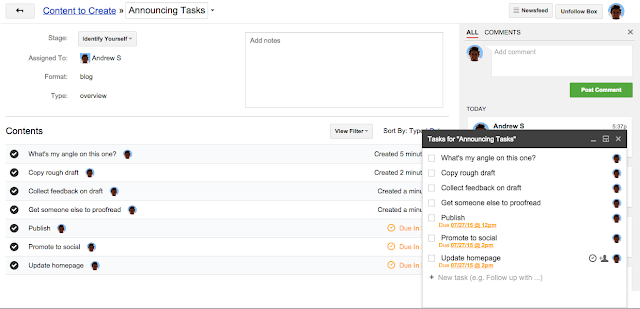
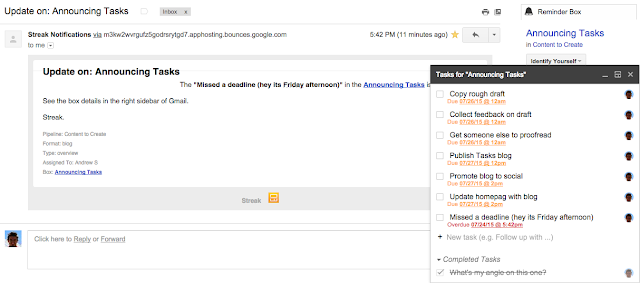
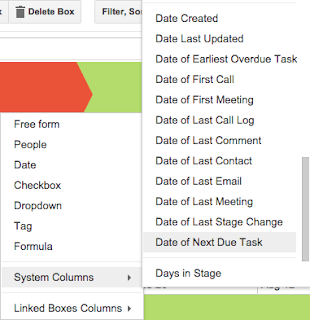
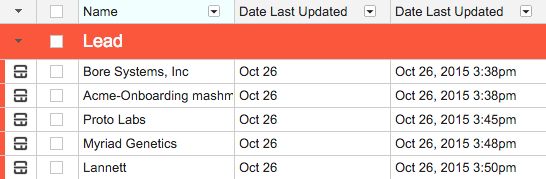
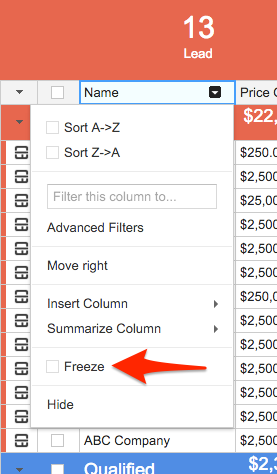
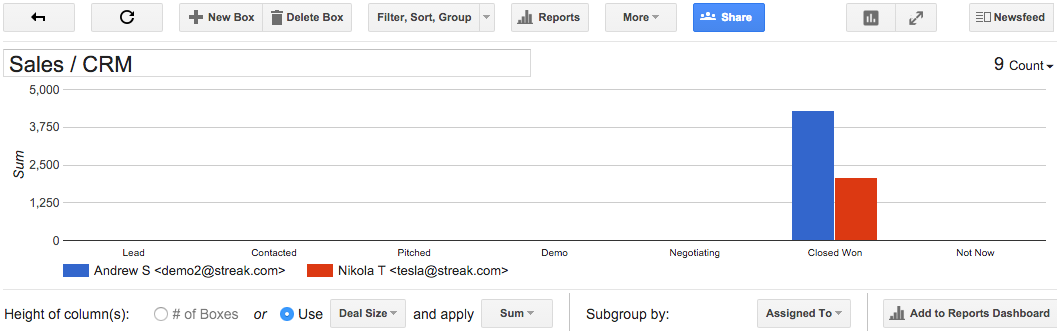
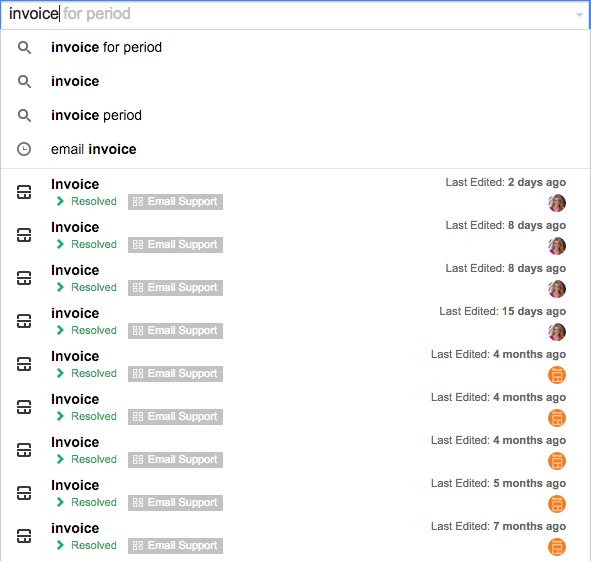
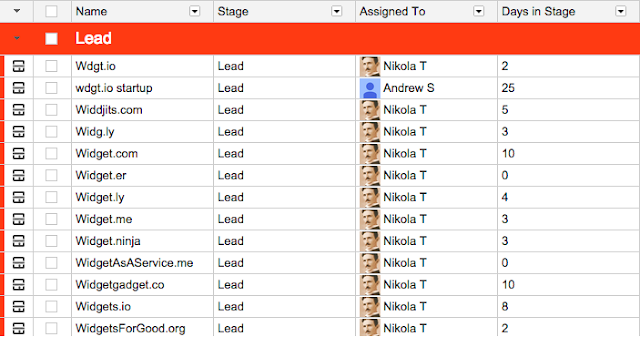
2. It's a big list - I'm not sure who I should follow up with first? Time to add a "Days in Stage" column and immediately benefit from Streak's automagic as the data is immediately available with no effort on my part: 

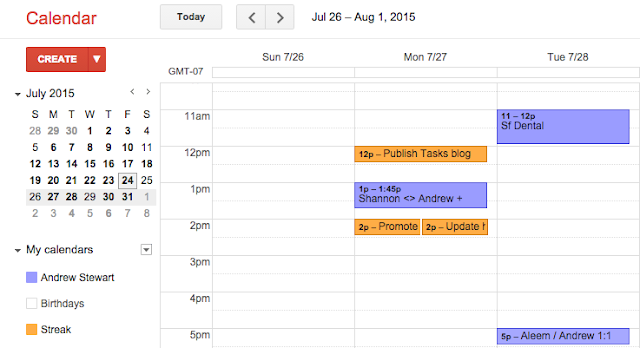
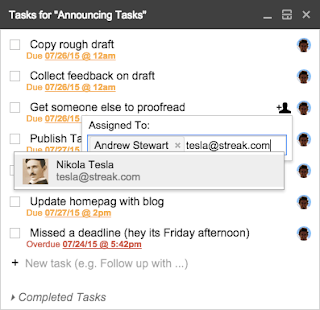
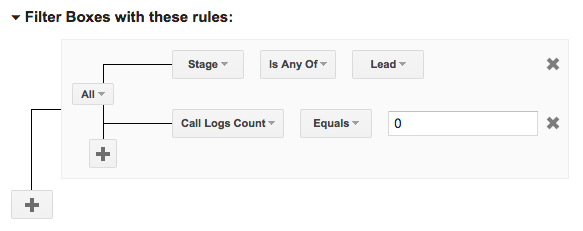
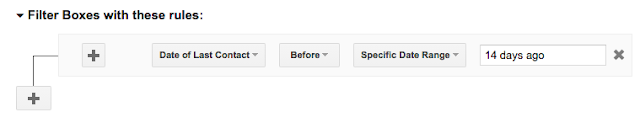
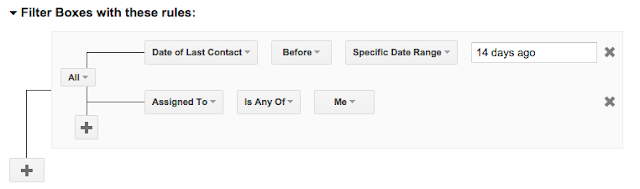
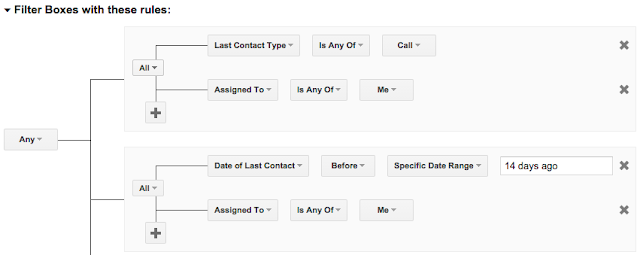
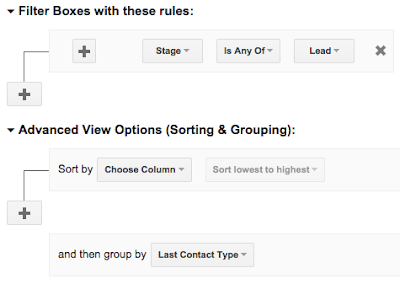
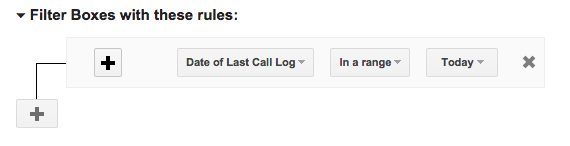
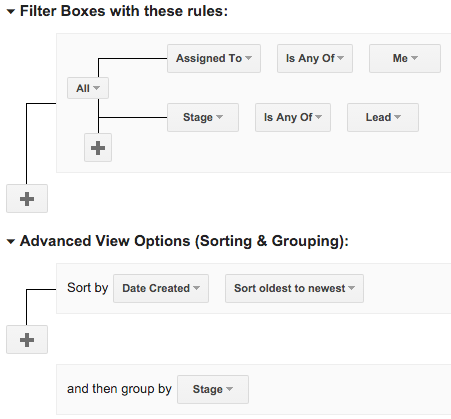
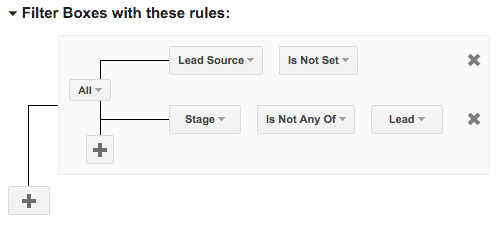
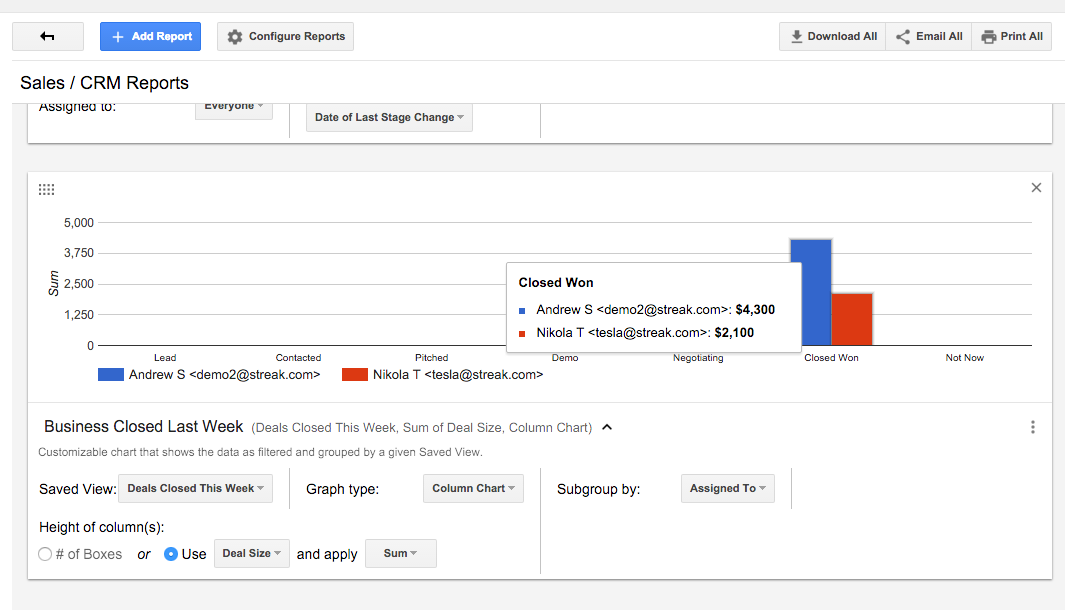
3. Above the pipeline, select "Filter, Sort, Group" to create the saved view:


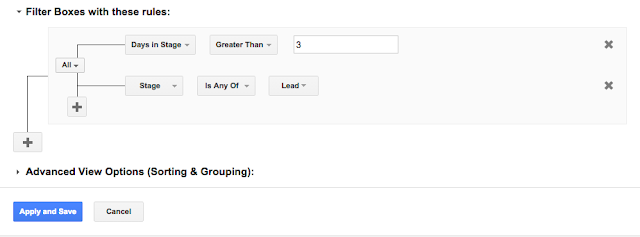
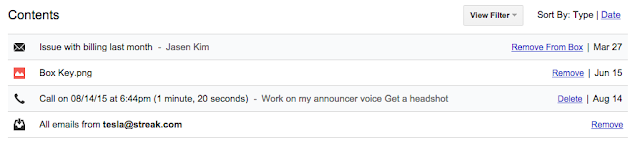
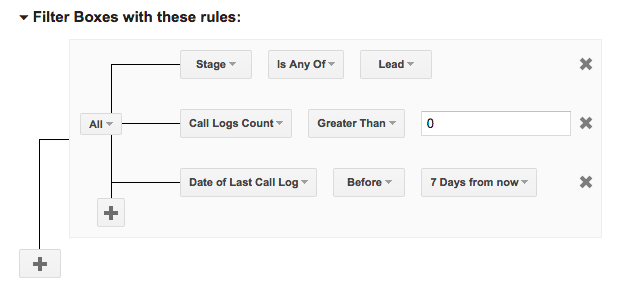
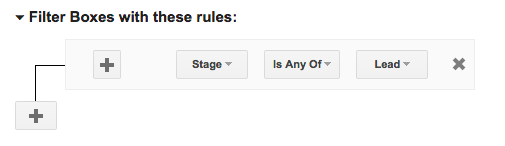
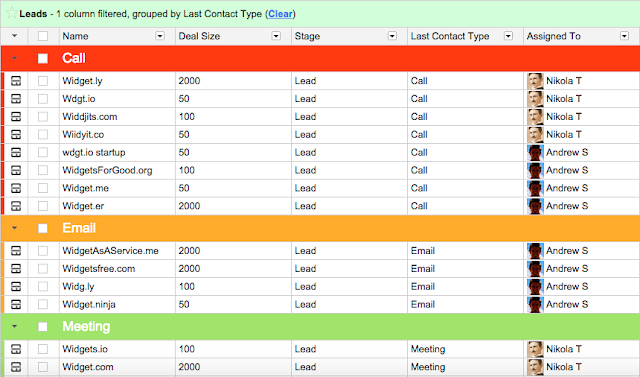
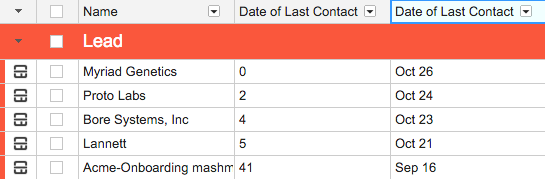
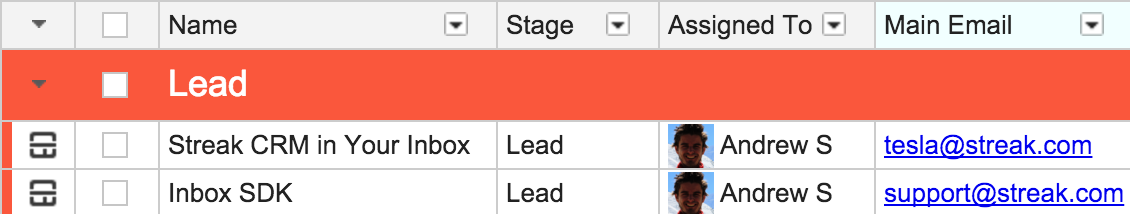
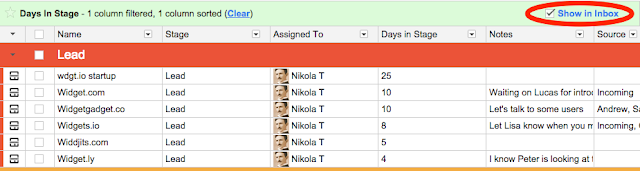
4. Click 'apply' and Streak will only display boxes that meet the criteria of Lead and >3 Days in Stage:

Adding the "Days in Stage" column not only gives an easily digestable data point when scanning my pipeline, it also enables me to turn my pipeline into a system that does the work of understanding who to follow up with right now.

BONUS Let's make this a bit more fun. I see in the above image that the pesky "wdgt.io startup" box has spent 25 days in the Lead stage. 25 days is too many! We don't want to ever let a box get that stale. In this scenario, my goal is that each box moves out of the 'Lead' stage in less than 14 days. If a box spends more than 14 days in the Lead stage, we want additional help surfacing that box.

Here's how we'll do that:
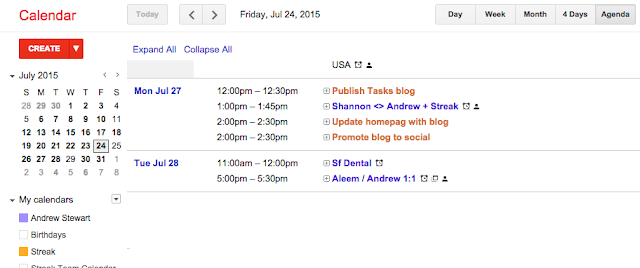
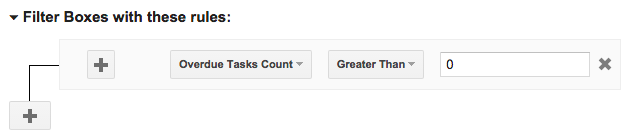
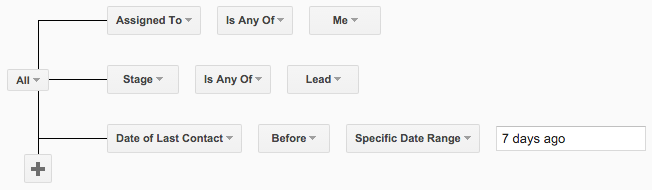
1. Edit our saved view to filter for boxes > 14 days instead of 3.

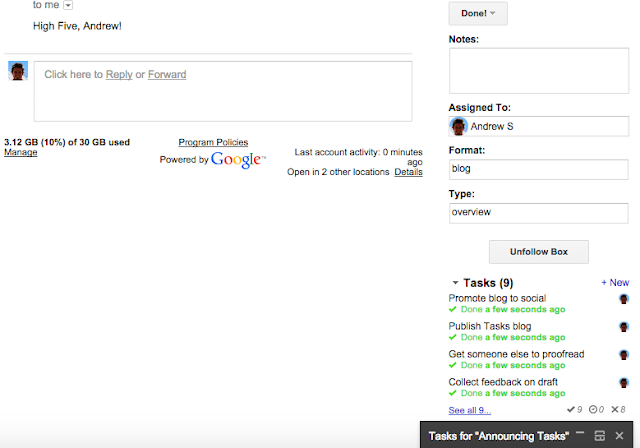
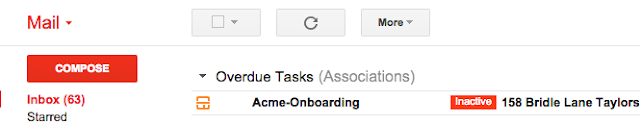
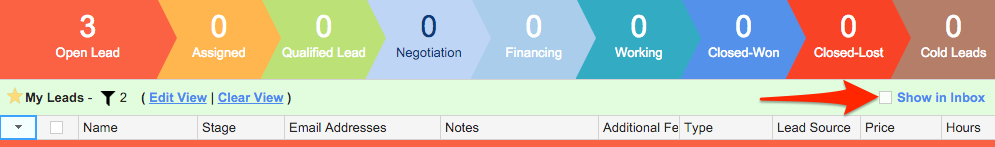
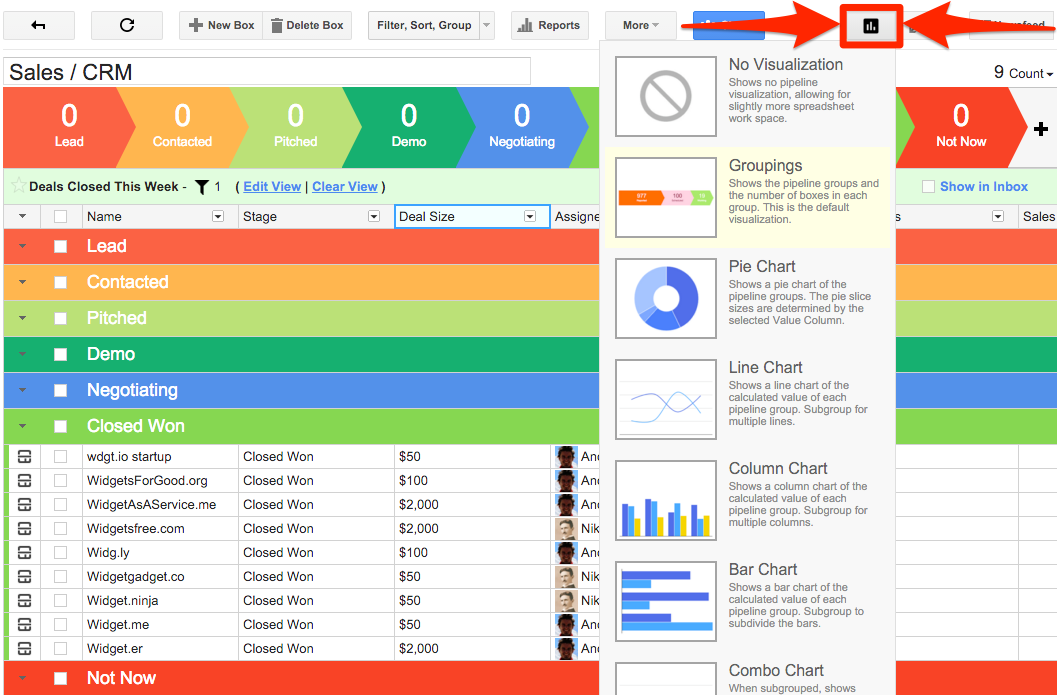
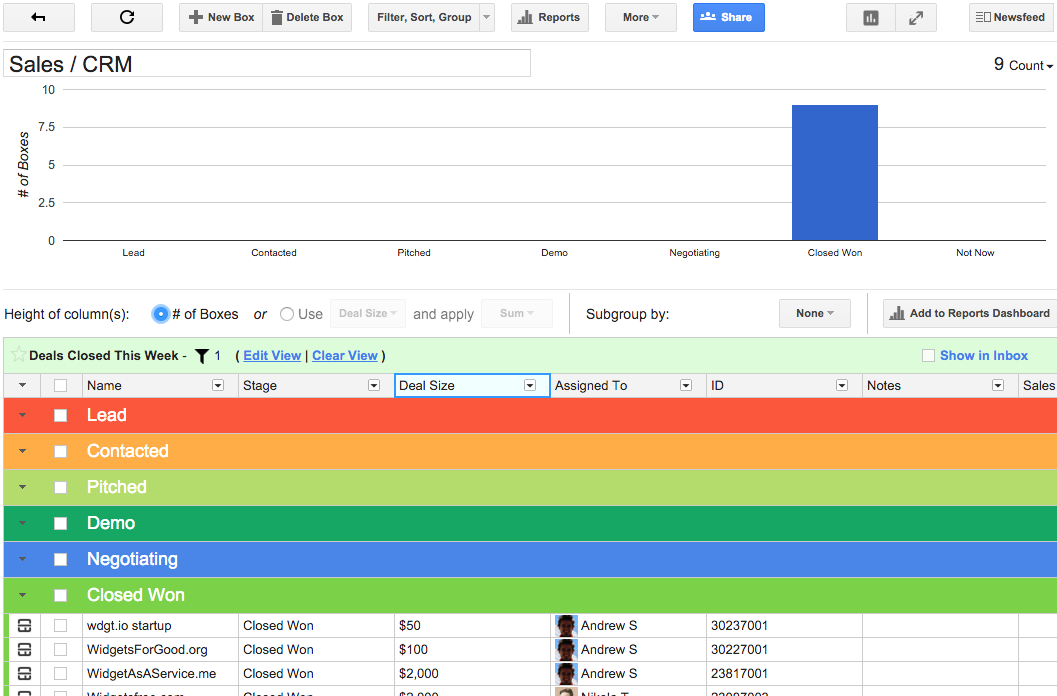
2. Then, let's zoom out on the screenshot above and point out the 'show in inbox' option:

3. When I go back to my inbox, Streak now knows to show me any boxes that exceed my target of all boxes moving out of the 'Lead' stage within 14 days. Automagic!

Resources:

Postscript - Fun fact: used as a noun, automagic triggers spell check - adverb only, folks.


Tasks/Calendar Preview

$
0
0

Interested in receiving new features before everyone else?

We always test our new products internally at Streak before releasing publicly. If you'd like to access our new features at the same time that we get them here at Streak HQ, write us: NewFeatureTester@streak.com (in return, we'd appreciate feedback and bug reports).

Tasks and Google Calendar Integration Preview

Recently, we've brought you spreadsheet improvements (multiple box edits including copy/paste), Power Tool Refresh, and version 2.0 of Mail Merge.

Our next development sprint will focus on the box "Contents" section. We’re adding specialized features to help you manage Tasks, Call Logs, and Meeting Notes. These features will immediately take advantage of a new Google Calendar integration.

This development cycle is meant to address this question:

How can everyone (simply) know what needs to be done to move this box forward?

Addressing that question will be much easier with the new Tasks and Calendar integration (plus Call logs and meeting notes when released). (Disclaimer: The images below are just a preview, and the final version may look or function differently than shown)


The major news is that we'll be combining renaming our current Reminders to Tasks. They won't just be renamed of course, we're adding a whole bunch of new functionality to them.

As a quick reminder, the current box detail view:


Annnnnd... the new box detail view showing tasks!


Sweet - let’s click on a task so we can see the new Tasks popup:


You'll recognize the familiar date menu - this will not only give you email reminders of due tasks but also show your tasks directly in Google Calendar:


(Note that as you move around Gmail, the tasks popup will stay active as you navigate Gmail) 

In the same way you use ‘Assigned To’ for easy box management, each tasks will have an ‘assigned to’:


Finally, the always satisfying “Task complete” screen!


2 important changes to highlight:
1. Tasks will integrate with your existing Google Calendar! (excited to bring this commonly requested feature to Streak) In Google Calendar, you’ll be able to see all of your tasks/reminders assigned using Google Calendar’s familiar and excellent interface for viewing by day, week, and month.


2.  Tasks will merge the concept of a 'reminder' and a 'task'. The majority of users who create reminders include text (isn't data fun?). Engineering alert: All reminders will be tasks, but not all tasks will be reminders. (You won't be required to add a reminder date to a task)

Additional Points of Emphasis
1. Tasks will be assignable in the same way familiar way that you currently assign a box. Similar to creating a box, when creating a task  it will be assigned to you by default. If you choose, for example, after a sales call you can assign yourself a reminder and also assign your sales operations lead a task.

2. To accommodate the common case of one action (a meeting taking place) necessitating multiple new tasks, this new menu is designed for quickly adding multiple tasks.

3. Although not shown, corresponding system columns will be added when we release the first new content type. You will be able to automatically surface information like: number of tasks inside a box or date of next task.

Feedback (tasks@streak.com)

Send us your thoughts! Here are a couple of items that might help you get started thinking:
1. Is there anything shown here that you would expect to see? (Or, not expect to see?)

2. Is it to imagine how you'd integrate tasks into your process?

3. Do you anticipate using the new 'tasks' feature? If so:
A) What do you use Streak to do?
B) What kinds of tasks do you imagine making?

4. Anything and everything else.

(...if you aren't excited by the idea of tasks, what could we build to excite you?)

Feature Announcement: Tasks 2.0, Google Calendar Integration

$
0
0
Hooray for Feature Announcement Days! Today we bring you the first of several big upcoming feature announcements - stay tuned!

To demonstrate, follow along as I use the new Tasks feature to create a blog post about the new Tasks feature (meta!). (A second post covering how to use Tasks at scale will follow shortly)

Using Tasks to Move My "Tasks Announcement Blog" Box Through My Pipeline

So - I'm sitting at my desk and outlining my next 'Getting Started' video to help new users (tasks deep dive video, quick start video). Then - news breaks: Tasks 2.0 is about to launch... woohoo! I have a new project, so I need a new box:
(Yes, I do give all of my personal pipelines whimsical stage names). 

Making a box is a good start, but I'm looking at a blank slate right now. How do I remember what I need to do to move my Blog Project to the 'Done Something' stage?

A tasks popup appears! The above image is titled "Let's do some taskin'" so let's do just that:

Great - a solid list to start. I already have a 'meta' theme going in this Blog, so let's mark the first task as complete:


I've created 7 tasks, already completed 1 of them... and I've also set 3 due dates. "Due Date" you ask?

One. More. Thing! Google Calendar Integration

Adding 3 Due Dates will make my life easier to manage because:
  1. I will receive a notification when the task is due. I have personally opted to receive emails, so I can count on a message being sent to me when the Due Date (and time) arrives. (review your current setting by going to "Streak Settings" - support@streak.com if you need help)
  2. Setting a Due Date integrates with Google Calendar automatically
Hey, I wonder what I'm doing next week?

Oh, right! Get this ready to publish this by Monday, hit the dentist, and then have my one on one with our fearless leader. (Thanks for the heads up, Calendar - I better be ready on Monday if I have CEO time Tuesday).

If you're not a 'week' kind of person, maybe you're more into the 'agenda'?

What happens (theoretically, of course) if you miss a deadline, just once?

Also, I get a the following notification...

I'm constantly switching up my process as I improve my efficiency. Because I use Streak, changing my process on the fly is easy. Now that I'm looking at my list, it makes no sense that I've only set some items to have a due date - let's make some quick edits:

As we go along here, I'm starting to get a bit stressed out. I need help! Let's get someone else to do my proofreading:


And, assigned:

Finally, you can access the same "Tasks" popup menu to view, edit, or create tasks from email:


In review, for any individual box, you now know how to:

  1. Open the 'Tasks' popup menu
  2. Create a new Task (and then hopefully assign it to someone else)
  3. Give the task a 'Due Date' ... and automatically sync with Google Calendar!
  4. Work with tasks anywhere in Gmail
Free and Starter users may create up to 20 total tasks for free to test this feature. Corporate plan users may create an unlimited number of Tasks.

Final Note: Replacing "Make Task" and "Reminders"

Tasks is replacing both 'reminders' and 'make task'. Note that all existing data from 'make task' or 'reminder' will be transferred automatically for you.

Call Logging Preview

$
0
0
You may have thought the whole team would be off to Hawaii after our launch of Tasks 2.0 last week... we didn't make Hawaii, but we are off to the next best thing: Call Logs! We shall not rest at Streak HQ until there isn't a single additional change we can make to help you sell more, hire efficiently and give better Support.

Before we finalized our design for Tasks 2.0, we asked for your feedback. All of the thoughts sent our way were incredibly useful in creating the best possible Tasks implementation. Looking ahead to Call Logs, we're excited to offer another preview. So... here's what we have planned for you, so far!

A few questions to think about as you read this post:
  1. What can we do improve or add to Call Logs based on this preview?
  2. Which features are 'nice to have', which are 'must have'?
  3. Do you plan to use this to track your own process or to manage a team's activity?

    Call Logging Preview: How do I track interactions that don't happen over email?

    Call Logs and Meeting Notes will build upon our brand new Tasks 2.0 feature. We added 6 new System Columns for the Tasks feature so that you can better scale your process. "Due Date of Next Task"? No problem! You can look forward to an equally granular level detail in Call Logs and Meeting Notes. And, you can look forward to additional Google Calendar integrations in Call Logs and Meeting Notes.

    Show and Tell time! To create a call log or meeting note, we’ve added 2 new buttons to the box view:

    For both Call Logs and Meeting Notes, you'll want to know: who, what, when. Because those data points are shared, the function of both will be very similar. To keeps things simple, we're going to focus on Call Logging in this post. 

    Similar to the Task UI, Call Logs and Meeting Notes are a persistent window that stick around as you navigate Gmail. This will help you take notes on a call while you’re looking up other information:

    Let's unpack everything included, starting up at the top with Use Timer and Fill From Calendar!
    Fill from Calendar: We're extending our Google Calendar Integration from tasks to Call Logs. Connecting your existing Google Calendar invite to the Call Log will enable Streak to easily pull additional information about your meeting.
    Use Timer: Start and stop the timer, and we'll do the rest! 

    If you choose not to use these features, you can set this information manually:

    You’ll also be able to choose how you’d best like to take notes. You can simply type in some text, but if you already have a favorite note taking tool, we're planning some fun integrations:

    Attach a Google Doc: Collaborate on a Google Doc for shared Meeting or Call Log notes.
    Attach a Evernote: For the Evernote aficionados - bring your existing notes into Streak!
    Attach a URL: Link a URL of your choosing to associate files beyond Google Docs + Evernote.

    Finally, we also want to allow you to easily navigate around while you’re on the call. We're calling it the "jump bar" and it will quickly link you to the Previous Call, Tasks for this box, and the Box itself:

    Call Logs and Meeting Notes - Feature Release

    $
    0
    0

    Calls Logs, Meeting Notes, and Tasks, Oh My!

    We’re very excited to take the wraps off our most recent additions to Streak: Call Logs and Meeting Notes! Combined with our recent launch of Tasks, you can now ask your Streak pipeline powerful questions like “Which of my boxes contain a task that is due today?” or “Which of my leads have I not called this month?”

    Call Logs and Meeting Notes are both different ways of tracking "Who, What, When, Why (Where)" for interactions that happen outside of email. We'll dive into Call Logging for this blog, but everything you see will also apply to Meeting Notes. (If you're more of a "see the movie" than "read the book" kind of person - video tour here). All feedback is encouraged! feedback@streak.com

    ...Let’s Go On a Tour!

    Picture, if you will: You, at your desk. You’re doing your Gmail thing, updating Streak boxes and closing deals. The phone rings! It’s dotly.ly calling to have a quick chat...

    ...here we go! Because you were working in your inbox - you navigate directly to dotly.ly’s box using the main Gmail search:


    Then, (woohoo!) you navigate to the "Contents" section and and give the shiny new ‘Call Log’ button a firm, confident click:

    Up pops your first Call Log!

    For ease of use, we’ve automatically scraped the time/date and included a timer option. The timer will run until you stop it or 'save and close' the Call Log. If you’re logging a call that has already happened, use the ‘choose time’ option to select a pre-set call length.

    Now that we have our Call Log open, we may want to move around our Gmail and reference other boxes or emails. With a couple of clicks, we might have navigated to an email, then into the box of that email, and then to a message that’s been shared with us via Streak. As you work, your Call Log popup is staying with you so you can continue to take notes, open your Tasks to create a reminder, and edit your pipeline (etc):


    When you're ready make some updates to your original box, you're just a click away! The “Box” button will take you directly back to the box associated with your current Call Log. (Similarly, to promptly peruse previous Call Logs we’d point out the ‘Previous Call’ link)

    We've added many new complementary System Columns to power your pipelines (2nd blog dedicated to the new System Columns to follow). For now, feast your eyes on this summer bounty crop of System Columns (and this is only 1 section):

    A brief discussion on caring for your "Contents" section:

    When you add an email to a box in Streak, we're creating an association between the Streak box and your existing Gmail. The itself thread stays happily at home in your Gmail. If you later decide that message should no longer be associated with the box, you can ‘remove from box’ to break the link. You are not, however, deleting the original mail. Call Logs and Meeting Notes are pieces of data that only exist in Streak - for that reason, the UI is offering to ‘delete’ and not ‘remove.’ Deleting a Call Log, unlike removing an email, is permanent:

    Looking to the future:

    A note on “coming soon”: We wanted to get this update into your hands as quickly as possible. You'll find there are a couple of features in the UI that aren’t available today. We’ll develop  incremental updates as we go. That also means: We’d love to hear your feedback on what we’ve built! It’s live and in your hands, but never final...

    Send us your thoughts! feedback@streak.com

    Call Logs, Tasks, and Meeting Notes at Scale - Part 1

    $
    0
    0

    What's your story?

    Every pipeline tells a story. Our goal is to make that story easy to read. Call Logs, Tasks, and Meeting Notes are new tools you can use to illustrate, punctuate, and organize your story for easy reading.

    Before we dig into the 'how', let's do a quick review of the 'what':


    As a super quick refresher on Streak terminology:
    - System Column: Columns where Streak automatically creates and updates the data for you, like "Date of Last Meeting."
    - Saved View: A way of finding and displaying boxes based on your own custom criteria, like: "Hey Streak, only show me boxes that are Assigned To Me."

    It's All About the Data

    We now offer Thirty Six different System Columns! Here is just a sampling of our expanded offerings:
    (... if that screenshot doesn't get you excited, we don't know what will!)

    To demonstrate the basics of using Tasks, Call Logs, and Meeting Notes at scale, we'll walk through 5 different pairings of System Columns and Saved Views. And, we'll toss in a bit of backstory for your easy reading pleasure (hey, we're working a theme here).

    Note this blog is Part 1 of 2, and this blog is only focusing on System Columns and Saved Views. We have additional tricks up our sleeve for Part 2.

    First, a brief reminder of where to find the "Filter, Sort, Group" button to create Saved Views:

    Pairing Saved Views with System Columns to Match Your Workflow 

    (Like fine wine and good cheese!)

    1. Never forget a to complete a Task:
    You have a growing pipeline that currently contains 1,000 boxes. You've been adding Tasks with Due Dates to your boxes as you work. On Friday afternoons, before wrapping up your week, you want to make sure there aren't any hanging forgotten Tasks. Use the following filter to have Streak show all boxes containing 1 or more 'Overdue' tasks:

    In this example, you are almost entirely up to date and Streak only finds 1 overdue item:

    Getting as much visibility as possible into my Overdue Tasks is important to your process. Let's going to take the next step and bring this view directly into the inbox with the "Show in Inbox"option:

    Back in the inbox, this View is now pinned to the inbox as: 

    2.  Alternate approach to above: Sort all boxes in your pipeline based on the "Date of Earliest Overdue Tasks Count" column. 
    First, add the column:

    Then, sort the boxes according to the number of Overdue Tasks:


    3. You run a sales process in Streak. The first part of your process is to call all Leads who have not yet been called:

    ... building on that process: Once you've made initial contact, you want no more than 7 days to pass before following up with another phone call:

    4. You have an Account Management pipeline, and want to use it to keep up with clients. 
    Your primary goal is to have contact (call or meeting or email) at least once every two weeks:

    ... we can even improve this and only show boxes that are also assigned to me:

    .... time for something a bit fancy! In addition to keeping up with your clients every two weeks, you want every call to be followed up with an email. In the view below, we have two filters, and each filter has two criteria. Streak will now return boxes where either (Date of last Contact is more than 14 days ago and Assigned To is 'me') or (Last Contact Type is a call and Assigned To is 'me'):

    5. Now that we're getting into the fun parts, let's use 'group by' to see a new perspective of our pipelines. (It's kind of like looking at your pipeline... and then turning your head 90 degrees sideways)

    We'll start with just a simple filter showing us only boxes in the 'Lead' stage:

    ... which returns us all leads:

    We already selected only boxes in the 'lead' stage, so having them displayed to us according to Stage ('Lead') doesn't offer us any additional insight. Instead, we can group by the Last Contact Type (substitute column of your choice):

    Which displays the same boxes as above according to 'Last Contact Type':

    Grouping by 'Last Contact Type' is just an example. You may insert the column of your choice depending on the piece of data you want to use to organize your boxes. 

    Questions? support@streak.com 

    For reference, a list of new System Columns by feature:
    Tasks
    • Task Assignees
    • Tasks Count
    • Complete Tasks Count
    • Incomplete Tasks Count
    • Overdue Tasks Count
    • Date of Earliest Overdue Task
    Call Logs

    • Call Logs Count
    • Call Logs Duration
    • Date of First Call
    • Date of Last Call Log

    Meeting Notes
    • Meeting Count
    • Total Meeting Notes Duration
    • Date of First Meeting
    • Date of Last Meeting
    Contact (Call Log, Email, or Meeting)
    • Date of Last Contact
    • Last Contact Type

    Call Logs, Tasks, and Meeting Notes at Scale Part 2

    $
    0
    0

    Continued from Part 1

    In part 1 of our post about using Tasks and Call Logs, we demonstrated creating Saved Views based on the many new System Columns we offer. In part 2, we'll give 3 examples of how to layer additional features of Streak on top of Saved Views. We gave a full intro in the first post, so if you're feeling at all lost, please reference the previous introduction for a full setup.

    Without further ado, here are a few ways our power users create complete processes by combining Streak features:
    1. You manage a team of sales people. You want to see, on average, how much phone time it takes to move a deal from 'Lead' all the way to 'Closed Won'. Add the 'Call Log Duration' to your pipeline, and then bring up the Summary feature:

    In this case, we want to know the mean average of time on the phone it takes to reach the "Closed Won" stage. We selected 'average' and were automatically given these results:

    The total average time for boxes in the closed won stage is 22 minutes, 56 seconds. We don't have a very large sample size here, but the initial data implies each sale will consume roughly 30 minutes of phone time with a sales person.

    2. You manage a Support Team, and want to know how many days pass between reaching the customer on the phone and the issue being moved to the 'Resolved' stage. 

    First, we need to add a total of 3 columns: "Date of Last Stage Change,""Date of First Call", and a 'Formula' column. Then, we'll use the following formula to compare the timestamp of 'Date of the First Call' and the 'Date of the Last Stage Change':

    Which will return us the following results:

    In the above example we're counting the number of days between the dates in the two columns. Note we can also do the same for the number of hours. For easy reference, the example above is: 
    = Streak.dayDifference($'Date of First Call',  $'Date of Last Stage Change')

    If you're unfamiliar with our Formula columns:
    1. Formula reference on the blog.
    2. Our in-app help has examples and a reference (click the Streak icon in the top right of Gmail, and then 'help').
    3. For the do-it-yourself-with-google types, Streak formulas run on Javascript.

    3. As part of your Sales process, you want to send everyone a quick note thanking them for their time after each call. Put together a quick Saved View:

    Run your Mail Merge (reference) to send a personal note as follow up!

    The above represents a few ways you can begin to touch on all of Streak's features in setting up your process. It is not, however, an all inclusive list. Rather than show you every possible combination, our goal is to inspire you to get creative with all of the new toys available to you. We'd love to see what you build!

    As always, we'd be happy to help you think through all of the features we've touched on in this blog.

    support@streak.com

    Streak Pipelines: Now With Undo!

    $
    0
    0
    We invested significant effort this past summer to make editing a pipeline as easy and fast as possible. Among other improvements, we enabled copy/paste to a cell, row, or region. You sent lots of positive feedback our way (thanks!), but we also heard from some folks who accidentally pasted over the wrong cell or were just nervous they'd accidentally lose information with a careless paste. Keeping your data safe and happily at home in your Streak Pipelines is our #1 priority, so we’re very happy to introduce: Undo!


    Accidentally paste your 2015 Fantasy Football roster over the ‘Leads’ section of your Sales pipeline? Help is now just an Undo away! As with other spreadsheet features, Undo is built to be immediately familiar using Command-z (Mac) or Control-z (PC). Undo behaves exactly as you’d expect.

    And, if you get a little excited with the new feature and hit Undo one too many times, you can 'redo' with Command-y (Mac) or Control-y (PC).

    A few caveats to be aware of:
    • You can't undo a column that has been deleted out of the Pipeline
    • You can't undo a deleted box
    • You can't undo moving a box


    We’d love to hear your thoughts!support@streak.com
    (Send us a high five and we’ll reply with a video of your high five making it to Chris, the lead developer on this project)

    New Formatting Options for Your Streak Pipeline

    $
    0
    0

    When 100 isn't just 100

    Adding new columns to your pipeline is a key step in customizing Streak to fit your needs. Our new formatting options will make your columns more precise and easier to read. When 100 is actually $100.00, or Sept 24 is actually 24/9/2015, we're happy to say we now have you covered.

    Formatting can be added to Columns of type: Date (including System Columns!), Formula, or Free Form. First, let's find the "Format" option in the dropdown of a column we'd like to format:

    Free Form Columns

    Free form columns can store everything from a mailing address to the number of widgets on order. To handle all of the different kinds of information thrown at Free Form columns, we've included a variety of format possibilities:

    (... additional currency options continue off screen)

    Date Columns
    Streak offers Date Columns in various shapes and sizes. Whether you're using a custom Date field you edit or an automatically updated System Column like 'Date of Last Contact', you'll be able to apply the appropriate formatting:


    Custom Formula Columns
    Because Formulas might produce a date or a number, you're able to apply any of the number or date format options shown above.

    Show and Tell!
    Easier to read numbers (note 'Price Quote' is an automatically calculated Formula column):

    ... which Streak can now roll up into more precise column summaries:

    More visibility into Date & Time changes, note the same column is displayed left/right with different options applied:


    In the left column below, you'll see the "# of days since" applied to 'Date of Last Contact':

    As always, we'd love to help you get your columns perfectly formatted:

    support@streak.com

    Featurette: 'Freeze' Columns in Your Pipeline

    $
    0
    0
    In our last post we showed you how to use formatting to make columns easy to read at a glance. Today we're excited to bring you an update that will make pipelines with many columns easier to use: Freeze a column (or columns) while scrolling the pipeline!


    Adding columns to Streak is the best way to cleanly track the information that matters to you (column video references one, two). Streak offers unlimited columns so that you can Track Everything. Although you may not need many Columns on Day 1, as your Pipelines mature and your business evolves, column accumulation is natural. Keeping a column like 'Name' visible as you scroll helps to support those mature pipelines with 30+ columns (and beyond!). We're so excited to bring you this Pipeline update that we made you a video:

    Each Saved View in your pipeline already supports individual settings for:
    • Order of columns left to right
    • Which columns are shown (vs hidden)
    • Order of boxes top to bottom (A - Z, oldest to newest)
    Freezing works similarly and is also specific to each Saved View. And, note you can Freeze as many columns as you'd like:


    Consider these three steps on your way to Streak success:
    1. When in doubt: Yes, you should track that thing, and you do need a new column.
    2. If you're tracking a number or a date, use the appropriate Formatting and read your pipeline at a glance.
    3. Use Views (video) to show the relevant information in the appropriate order - and, of course, freeze the columns you want to always be able to see.
    Write us - we're friendly, we'd love to hear from you, and we're waiting to help with Streak!

    support@streak.com

    Feature Release: (Re)Introducing Streak Reports!

    $
    0
    0
    Think back to the original reason that you started using Streak - whether you were looking to sell more, improve support for your users, manage your dealflow, or coordinate your hiring - you wanted to improve. So that you can better measure your pipeline performance over time, we’ve completely rebuilt our Reporting feature. We’re excited to show you the rebuilt interface and all-new charts! Before we dive into details, a quick teaser:

    Feature Highlights

    Sometimes showing is better than telling:


    Expanded Configuration options
    Reporting now understands where your process begins and what represents success versus failure. Spoiler alert: (Understanding 'wins' versus 'losses' is the foundation for new charts like "Close Rate" ...and more - stay tuned!)

    Select which charts to add
    As the screenshot of reporting configurations indicates, not all settings and charts are equally relevant to every use of Streak. When you hop from your sales pipeline to support, for example, value reports as less applicable. In reporting 2.0, see what you like and hide what you don't!


    Add multiple charts of the same type

    One basic metric we watch in our support@streak.com channel is the number of new boxes being created over time. In our support pipeline, each box represents a support need. An upward trend in volume indicates the need for more support resources. Below, we've used the 'Boxes Created' chart with 'last week', 'this week', 'yesterday', and 'today' so we can watch short term trends:

    Drag and drop charts to reorder and customize your view
    Once you start exploring your own data, you'll want to rearrange the layout. Streak is always ready to adapt to your process! In our new reporting feature, reconfiguring your dashboard is just a click and drag away. Drag and drop supports both adding and rearranging your charts.


      Sharing Reports
      At this point, we imagine you're adding, configuring, and rearranging your reporting to perfection. Digging into your own data is fun! After you've crafted your insights and are ready to show off, we're happy to say that no matter how you want to share with your team, we've got you covered:

      Download: Downloads high quality individual images of each chart in reports
      Email: Creates an email and populates charts
      Print: Creates a formatted page with charts and opens the 'print' screen


      As we teased above, all-new charts are on the way! What information from your pipelines would you like to see in Reporting?

      support@streak.com

      New Streak Reports: Become a Data Driven Business in 2016!

      $
      0
      0
      Our first post re-introducing Reporting was dedicated to our major design changes. Today, we're focusing on the most important addition: More data! Streak Reports now include a total of 14 all new Charts. Whether you're a Sales organization looking for reporting based on deal value or a Hiring team interested in reports based on communications with , we now easily surface previously unavailable data. Call logs created, emails sent, stage changes, deals closed, and more - if it happens in your team’s pipeline, we’ll help you analyze how your team can perform better.


      We can't wait to share Reports and this fresh new data with you because:
      1. Understanding team performance has never been easier. Call logs, meeting notes, and sent email is automatically tracked to offer a detailed understanding of any individual's communication pattern. For example: Imagine you were managing a team of sales representatives. As a manager, you want to know about my work the previous week. I could tell you how many leads I touched - or, you could use the "Interactions Summary" Chart to see the data for yourself:
        If I happen to be your best performing sales rep, you can compare my communication volume and timing to better understand what others can do to improve results.
      2. Reports tie together a series of improvements dating back to last summer. Recent additions to Streak like Call Logs/Meeting NotesColumn Formatting, and System Column updates all work together to easily translate your business into data you can analyze and improve upon. Use Streak to drill down on calls per rep for your team, create sales projections, and monitor incoming lead volume - all without leaving your inbox. 

      Time for a few quick examples! As a Sales team, use the complementary 'Value Won by Time' and 'Projected Close Value' Charts to see a comparison of both closed and upcoming deals:

      As a Support team, you may choose to include week over week comparison of volume and a 'Stage Flow' chart representing how your boxes are moving through your funnel over time:

      One interesting data point we can pull from the above charts is the frequency with which we move support tickets backward from Responded to Pending as new information is received.

      ... And we're just getting started! Next week, stay tuned to twitter, your inbox, and this blog for updates as we continue to improve Reporting by unearthing more data!

      Questions or suggestions about Reporting? support@streak.com 

      6 Saved Views to use in 2016

      $
      0
      0
      If we may be so bold, allow us to suggest a New Year’s resolution: Stop clicking on your pipelines! (... and start using Saved Views)

      As a pipeline-centric product, we're not saying stop using your pipelines. But, if you’re not employing Saved Views to have Streak show you the perfect box for what you’re working on right now, you’re working too hard. Use your pipelines - efficiently!

      For example, you’re most likely using Streak as part of a team. Rather than clicking on the main pipeline to see everyone else's boxes, use a Saved View that shows only boxes assigned to you. In a moment, we’ll walk you through other examples of Saved Views that successful teams are using to work smarter. First, a quick reminder of where to create Saved Views:
      (Quick note on plans: Any user may create a view. Only users on Corporate or Enterprise plans may save the view for future reference)

      Popular Basic Saved Views (based on aggregate user data)

      #1 Show Only Boxes Assigned To You

      We’ve collapsed the advanced options to focus on the filter. Note that in the above example, 'me' changes depending on which email address is used to open Gmail. When Lucas is logged in, me = Lucas. When Henry logs in, me = Henry. And, for full context, the next time you open up Gmail, you can proceed directly to your boxes by clicking on 'My Leads':
      Cut out the clutter and get directly to your boxes! 

      #2 Sort Your Pipeline Alphabetically By Box Name:

      For simplicity, in the above we’re only applying a sort. Similar variations:
      1. Order by date: Oldest to newest based on the system column“Date Created” (or other date column)
      2. Order by priority: Add a dropdown menu to your pipeline, rename it ‘Priority’, and sort!

      Saved Views used by Successful Teams

      #3 Basic - Boxes to Follow Up With
      Similar idea as only those boxes assigned to you, but now the View will only return results where the box is both ‘Assigned to me’ and in the ‘lead’ stage. We’re also applying a sort so that Streak shows us the most stale leads at the top of our spreadsheet.

      #3 Intelligent View of Boxes to Follow Up With
      Make your 'Follow Up' View even more intelligent by adding a 3rd rule looking for boxes that haven't been emailed, called, or visited during the last 7 days:
      ... and never let another deal slip through the cracks again.

      #4 'Show in Inbox’ Feature
      Pin your most critical boxes to the top of you inbox for maximum visibility. If we opted to use the 'Show in Inbox' feature for the follow up view we created above, we'd literally see the boxes we needed to follow up with shown above your unread mail. You'll literally never leave your inbox! (... no screenshot of what happens after clicking 'Show in inbox' - if you want to see, you'll just have to give it a try!)

      #5 Verify Data Integrity
      Here’s a creative example to illustrate the many possible uses for slicing and dicing your data. In the below example, the pipeline will only return boxes where the user has moved a lead out of the ‘Lead’ stage but neglected to enter a ‘lead source’:

      #6 Create Custom Charts from a Saved View via our Redesigned Reports
      … Stay tuned!

      If you’re excited about doing more with Saved Views in 2016, we'd also recommend this video on connecting Saved Views to Mail Merge (one of the most popular workflows in Streak).

      And, if you’re all of a sudden imagining creating 20 or 30 Views of your data, great! See here for help managing a full complement of Saved Views.

      Help making the perfect Saved View? support@streak.com

      Reports Update: Use a Saved View to Create a Custom Chart!

      $
      0
      0

      Custom Streak Reports: Create Your Own Charts

      Although our Reports redesign is barely a month old, we’re already unveiling a major feature update: the ability to create custom Charts from Saved Views. You can focus Reports on the specific information you need to improve your particular business and even add them to your existing Reporting Dashboard.

      If you're acclimated to analyzing your pipeline from the Reports Dashboard or with a Saved View - Now you can run a Saved View analysis and also save the results to your Reports Dashboard as a Chart for future reference. To maximize your customizing power we've enabled a deeper level of detail. Use our new subgroup option to, for example, create: 1) a Line Chart showing new Sales leads per week subgrouped by lead source 2) a Column Chart displaying business closed per week subgrouped by sales rep:

      *If that introduction has you looking for a refresher on Saved Views, start here. If you're new to Reporting, your introduction is here.

      Step by Step Instructions for: Saved View -> Custom Chart

      1. Create the Saved View that will be the basis of your Custom Chart. In this case, all boxes in the 'Closed Won' stage that closed this week (for simplicity, we're using a very small data set):

      2. Select how to visualize your Saved View results. The new options shown below are your key to creating Custom Charts from the pipeline. (More on Pipeline Visualizations at the end of this blog) For our example, we'll select 'Column Chart':


      3. Begin customizing your chart. If no changes are made, the default visual is simply a count of the total number of boxes:

      4. Apply a custom analysis. To do create a total of business won (instead of total number of boxes), we select the 'Deal Size' column and apply a 'Sum':

      5. Drill down into your data with a subgrouping (if applicable). The above Chart is showing us an aggregate total of business won, but we want the additional detail of per sales rep. To drill down on the individual rep level, we apply 'assigned to' as a subgroup:

      7. Optionally, Use the 'Add to Reports Dashboard' to save for your reference - don't forget to rename the Chart!

      Creating Charts from Saved Views inside the Reports Dashboard

      If you're already working inside of your Reports Dashboard, adding a custom chart is easy!

      1. From the 'Add Report' list, select the Saved View Report:

      2. ... that's it! You'll see the same Chart you're now familiar with (as if you had begun from the pipeline with a Saved View).

      On Pipeline Visualization

      While we're down in the minutiae of Streak with you, a word on Pipeline Visualizations: We're oversimplifying a smidgen by presenting Visualizations as always used alongside Saved Views.

      Technically, a visualization is always being applied unless you select 'No Visualization'. By default, even if you don't think you're using a visualization, we're showing you 'Grouping' visualization to display all your stages and the number of boxes in each one. Choosing 'No Visualization' removes the stages and maximizes the viewable space for your spreadsheet:

      Integrating Saved Views and Reports offers easy, powerful analysis of any data within Streak. If it happens in your pipeline, either we've already built the Chart you need, or you can easily craft your own custom visual.

      We'd love to help you configure your Dashboard and Saved View Charts! Support@streak.com

      Featurette: Linkify Email and URLs in Streak!

      $
      0
      0
      Immediately following our 3-part Reports series (redesign, fresh data, and Custom Charts), allow us to offer a small but significant update to brighten your week: Clickable links in your pipelines and boxes! To start brainstorming about your own pipelines, here are 6 useful ways to incorporate links into Streak:
      • Email address of main contact
      • Business homepage 
      • Link to invoice, resume, contract (or other similar key document)
      • Dropbox (etc) folder
      • Social media profile
      An example of email addresses in the pipeline:
      In the above, the 'Main Email' field now presents as a (blue, clickable) link. Single click on the field in the spreadsheet and you now have the option to open a new Gmail compose window:
      ... Initiating outreach from your pipeline has never been easier!

      If we revisit our sales pipeline from above, note you can also enter a URL: 
      To make life easier, we'll recognize the URL as a link with or without the preceding 'www'. Clicking a URL from either the pipeline or a box in Streak will open the link in a new tab. Speaking of boxes, links are also available in the right tab of your email:
      Final note: in this right tab view, a single click will open the link (or a new email, depending).

      What else should we be building to make your life easier in Streak?
      feedback@streak.com!


        2015 In Review

        $
        0
        0
        The product and engineering teams here at Streak are currently hard at work on a huge secret project that touches the very core of Streak. We can't wait for you to see it! Stay tuned to this blog as we start to share what we're building in 2016. Before we look to the future, let's take a quick peek through the archives and review 2015. 

        And - we should also say: Thanks for all your feedback in 2015! Whether you sent us a suggestion or a compliment, your input is the largest voice in deciding which improvements we make for you. With your help, Streak has never been faster, easier to use, and more powerful. Keep the feedback coming! feedback@streak.com
        For fun, a quick snapshot of (aggregate) user data pulled from the archives:
        • Emails added to boxes: 12 Million
        • Mail Merge (v2.0) sent since June: 125 Thousand
        • Boxes Created: 9 Million
        • Most popular day to create Call Logs / Meeting Notes: December 8, 2015
        • Additions to the Streak team in 2015: 4 (Welcome, Jasen, Henry, Brianna, and Mallika!)
        • Pipelines Started: 450 Thousand
        • Name of first pipeline after 12:00am on January 1st: “Career Search” (New Year’s Resolution: Find a New Job… note: We’re hiring!)

        2015 Features in Review: Reports!

        You asked us for better Reports to see how using Streak improves your results over time. We delivered! Whether you began using Streak because you wanted to close more deals, hire more efficiently, or offer faster support - Streak is the tool you rely on to be your best. All of the incremental improvements we made in 2015 led to our enterprise-ready Reports, which are now redesignedfull of new data, and completely customizable:
        The roadmap to prepare for remaking Reports included:
        1. Adding Call Logs, Tasks, and Meeting Notes to more accurately capture all of your activity. 
        2. Making Streak even easier for the end user to work with. 
        New data + updating = more information = The best, most accurate Reports available

        Because Streak is the best CRM for users it's also the best CRM for managers. An unused CRM contains no insights.

        Let's start with a quick review of the new data types first: 


        We envision Streak to behave like any other spreadsheet you're familiar with using. When things work like you expect, you don't have to think about doing - you just do. Streak supports batch copy/paste (including to/from Sheets or Excel) of entire columns or regions. And, if you make a mistake, command-Z (control-Z) does exactly what you'd expect: Undo! Make your pipeline easier to read by 'freezing' a column during scroll and then add the appropriate Formatting. Add an email or a website and we'll automatically understand it should be a link. Streak. Just. Works!


        Outside of the spreadsheet, we built a new way to find any box instantly using autocompleted results in the search bar. And, you can also see if existing email is added to a box using our expanded selection of inbox indicators. We added new Magic Columns (oncetwice) to encourage the creation of more Saved Views, and then built out a way to manage all of your new Views.

        Finally, we'd be remiss to overlook the refreshed Power Tools and our incredibly popular update to Mail Merge.

        Stay tuned for what we have planned for Streak in 2016!

        Streak, Meet Clearbit.

        $
        0
        0

        Our friends over at Clearbit just unveiled a great new add-on for Gmail that not only shows you more information about the people in your inbox (think original Rapportive on steroids), but also acts as a global address book - allowing you to find emails for new business contacts in seconds. Best of all, it's built on top of our very own InboxSDK!

        After installing Connect, Clearbit will start to display information about the people behind the emails, right in Gmail's sidebar. They look at over 200 sources live to pull in personal info like title, company, and social handles, but unlike others in the space, they also return business intelligence like funding raised, company location, and employee count.


        The real game changer though, is Connect's prospecting feature, which allows you to search by company and title to find just about anyone's corporate contact info. It really makes quick work of cold outreach.


        We’ve secured an exclusive invite code that’ll let you jump the queue on the beta - just use this link.

        We have another collaboration with Clearbit in the works which we are super excited about. Stay tuned for more!

        Formula(s) for Success

        $
        0
        0


        The biggest benefit of Streak is the ability to customize anything, whether it’s columns, pipelines, charts or stages. Internally we use Streak for everything; sales, customer support, product development and hiring. A feature I rely heavily upon for my daily work is the formula column. They may look scary, but formula columns will change your life!

        My job is to stay up to date with customers and provide relevant and timely advice when using Streak. I reach out to my trial users on the 1st, 3rd, 7th and 15th days of their trial. This would typically be an organizational nightmare requiring me to sift through thousands of boxes in search of the date and contact details I’m looking for. Not ideal.

        A second option is to create separate columns for each of these milestone dates, though this would require manually calculating dates every time a new lead appears. This gets tedious and leaves room for human error. As a result, my leads fall through the cracks and my boss is unhappy.

        ….behold, the formula column!


        The formula below simply adds 3 days to dates in a given column:

        = if($'Trial Start Date'=='' || $'Trial Start Date' == null)
            {null}
        else
            {Streak.addDays($'Trial Start Date', 3)}


        The formula to calculate a 3-day follow up, while accounting for weekends, is: 

        = if($'Trial Start Date'=='' || $'Trial Start Date' == null)
            {null}
        else if($'Trial Start Date'.getDay() >= 3 && $'Trial Start Date'.getDay() <= 5)
            {Streak.addDays($'Trial Start Date', 5)}
        else if($'Trial Start Date'.getDay() == 0 || $'Trial Start Date'.getDay() == 6)
            {Streak.addDays($'Trial Start Date', 4)}
        else 
            {Streak.addDays($'Trial Start Date', 3)}

        If-statements are useful to track two or more outputs. It basically tells the system: if this, then that. In the formula above, Trial Start Date is the name of the column that tracks start dates. If no value (ie. date) exists in a cell, the statement is told to leave it blank. This is what the null commands refer to. Without this, the cell would display an error message.

        The rest of the formula tells the system to assign certain values based on the date entered. Days are tracked by a numeric system - 0 is Sunday, 1 is Monday, etc. The .getDay() command tells Streak to retrieve the number associated with the date. If it’s between 3 and 5 (Wednesday - Friday), then the system adds 5 days to the follow up column. As a result, it accounts for the weekend. The second command says that if the value is 0 or 6 (Sunday or Saturday), then add 4 days. Lastly, any other value (Monday or Tuesday) should add 3 days. By accounting for every day of the week, I make sure that my customers receive information during the weekdays rather than the weekend.


        Once these are in place, I create individual Saved Views for each milestone day (one for brand new trials, one for 3-day follow ups, etc….) and hide the remaining date columns to reduce the clutter in each View. The last thing I do is set a filter, and equate the formula column of interest (eg. ‘3-Day Follow Up’) to ‘Today’.


        Because I don’t have to specify a particular date, ‘Today’ displays relevant results for me everyday. To further explain, every time the date in one of these formula columns is the same as today’s date (eg. Feb 1st), those matching boxes will be displayed in my Saved View. The formula is sophisticated enough to skip the weekend, so trials that start on Thursdays or Fridays are automatically scheduled for their 3-day follow up on the next Tuesday.


        This organizational hack, alongside basic snippets, has made my job and life far easier than before.

        If you want to start with a simpler formula, try to calculate the number of hours or days between two dates. Create 2 date columns and 1 formula column. Format the date columns to include the time stamp:


        In the formula column, enter the following formula to calculate the hour difference between both dates: 

        = Streak.hourDifference($'Trial Start Date', $'Follow Up'). 

        If you want to calculate the difference in days instead, try this:

        = Streak.dayDifference($'Trial Start Date', $'Follow Up').


        Play around with formula columns, filters and Saved Views to see how they can save you heaps of time and effort everyday, too. To get started, check out our formula support in In-App help, read our Formula Columns blog post or reach out to support@streak.com for further assistance.

        PS: if you want to copy the formula columns I've used above into your own pipelines, make sure there are no extra spaces/indents between the commands!

        Searching for a box in Streak: Typos Encouraged!

        $
        0
        0
        We've replaced the brains behind our search algorithm with even brainy-er brains! You can immediately begin enjoying an auto-complete experience (reference on auto-complete) that reads your mind and always shows the perfect results.

        A couple of quick demos to show off: Let's say you're a sloppy typer (like me!) and you happen to miss a character or two - no problem!

        ... if that's a little subtle, the search correctly interprets my improvd as 'improved' and rsults as 'results'. And, we can correctly fill in the gaps using only a few words in a name to find the correct box:

        One final trick to show off! Results are contextual based on most recently edited so that we show you active boxes first:

        As an added bonus, note these improvements also apply for the times you click through to search results. For the technology and startup enthusiasts, h/t to algolia for their search magic!

        Happy finding!

        Introducing: Magic Columns!

        $
        0
        0
        Streak Magic Columns are the exception to the adage 'you can't get something for nothing.' Magic Columns just give you automatically updated information about your leads (or support tickets, hiring candidates, etc) so that you can enter less data and close more deals.
        • Sleeping? Streak is gathering data to help you get to 'Closed Won'. 
        • Working on a particular lead? We've still got your other boxes covered - no data input effort required.
        • ... Watching cat videos in the office kitchen? Streak has your back. 
        We're automatically watching and updating 13 different data points... about email alone. In total, there are 53 different Magic Columns you can use to close more deals, tickets, candidates - or anything else you throw at Streak.

        If you're already a Streak user, you may be saying to yourself, "Neat! ...but, this sounds a lot like System Columns?" You caught us. Two quick points:
        1. System Columns are now known as Magic Columns because... Magic! (@Henry: Thanks for the inspiration of the sparkle icon):
        2. More importantly, we've introduced a new crop of Magic Columns (full list below).

        9 New Magic Columns!
        1. Overdue Task Assignees (all users in a box who currently have an overdue task)
        2. First Email From (email address of the person who sent the first message)
        3. Total Email Message Sent Count
        4. Total Email Message Received Count
        5. Date of Last Sent Email
        6. Date of Last Received Email
        7. Date of First Email
        8. Date of First Sent Email
        9. Date of First Received Email
        5 Methods to Make the Most of Magic Columns
        1. Find Boxes With Your Overdue Tasks: 

                                                 
        2. Sorting on Magic Columns: Use a Magic Column to sort your pipeline (note the clever formatting to show you '# days since'):
        3. Formula Column + Magic Column(s): Use a Formula Column to see how long it takes your reps to reach out to new leads (calculate the number of hours between the Magic Columns 'Date Created' and 'Date of First Sent Email'). Excellent formula info here and here. Example formula: = Streak.hourDifference($'Date Created', $'Date of First Email') ... (Corporate and Enterprise users only)
        4. Column Summaries + Magic Columns: Use column summaries to see the average number of total emails it takes to resolve a support ticket:

          (Corporate or Enterprise users only)
        5. Saved Views + Magic Columns: And, of course, any Magic Column can be used as the key ingredient(s) to craft the perfect Saved View to help you complete a task like reaching out to new candidates, following up on leads, or closing support tickets (read up on Saved Views)!   ...(Corporate or Enterprise users only)
        For additional reading on Magic Columns, check out last our posts last March and June.

        Suggestions for a Magic Column we should add? support@streak.com

        Viewing all 125 articles
        Browse latest View live